WELCOME TO YWYEN LAB
Research
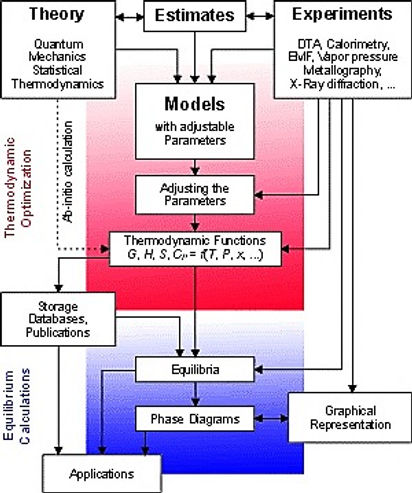
相圖計算(CALPHAD)方法
相圖可提供純元素或合金在各種溫度下的基本訊息,包括存在的穩定相、元素組成、相之體積分率和轉變溫度等有用的重要資訊,因此相圖在材料研究及應用中的扮演著非常重要的角色。
相圖計算也就是CALPHAD,是廣泛用於材料研究中的一種方法,以了解組成、微觀結構和製程條件之間的相互關係。此方法將實驗得到的數據,轉換為熱力學模型中組成相的吉布斯自由能的優化參數,然後這些參數可以用於計算相位平衡。根據各種組成相的晶體結構建立熱力學模型,透過評估篩選特定溫度、壓力下多元系統的實驗與理論計算數據,再經過優化後,可確定各個相的自由能,最後建立系統的材料熱力學數據庫,而理論計算包括第一原理計算、統計學方法、經驗與半經驗公式等等。
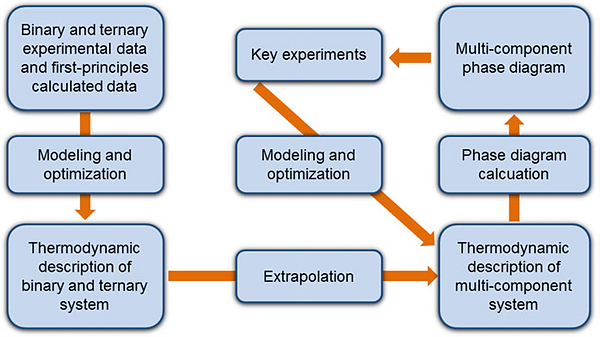
此方法目的不僅僅在於重現已知現象(二、三元合金系統)的熱力學性質和相圖,而且還能為未知系統(四、五元合金系統以上)估計其熱力學性質和相圖。從二元或三元系統的熱力學數據來計算多元合金的熱力學性質,或從實驗容易準確測定的數據來推斷不易準確測定的實際情況,例如高溫、高壓的特殊情況。
目前大多數二、三元系統合金已有實驗數據,且已轉換成熱力學數據庫,可說是相當成熟,但對於多元系統合金的資訊仍較缺乏。由於四元以上系統涉及大量變數及參數,因此如以傳統製作相圖方式,以大量實驗點去定義多元系統的相圖和熱力學參數是不切實際的。近年來,已證明將CALPHAD方法與關鍵實驗數據做結合,是構建複雜多元系統熱力學資料庫最有效且可靠的方法
J.W. Yeh, JOM 65, 1759-1771 (2013)
C. Zhang, M.C. Gao, High-Entropy Alloys (Springer, 2016)
高熵合金(High Entropy Alloy)
多元組成的合金研究最早可追溯至西元1981年,直到2004年清華大學葉均蔚教授將高熵的概念應用在合金上,正式提出「高熵合金」後,為金屬材料的開發設計開啟了另一片天地,也正因如此葉均蔚教授被譽為「高熵合金之父」。葉教授對高熵合金提出了兩種定義:
1. 組成定義:五種或五種以上元素以5 ~ 35 at.%的混合,而其次要元素則不超過5 at.%
2. 組成熵定義:原子在隨機排列的情況下,組成熵大於1.5 R (R = 8.314 J/mole K) 即可稱為高熵合金。
高熵合金能避免在多元系統中出現以往認知的複雜結構,取而代之的是固溶相的簡單結構合金。然而能形成簡單的結構是由於多種元素隨機混合形成固溶相時,混合熵會相當大,根據自由能定義 ,能降低整體系統的自由能,雖然多種元素間可能有正或負的混合焓,但在高溫下,混合熵的影響會遠大混合焓,使得系統的自由能仍可趨向負值,而得到穩定的固溶相。同時,「高熵」的概念也帶出了以熵來分類合金的方法,如下圖傳統合金其混合熵小於R;若混合熵介於R和1.5 R間為中熵合金,通常由三到四種元素組成;若理想混合熵大於1.5 R,則屬於高熵合金。

J.W. Yeh, JOM 65, 1759-1771 (2013)
高熵合金四大效應
高熵效應
(High-Entropy Effect)
高熵效應是高熵合金中最重要的特性,藉由增加元素的種類,使得混合熵 上升,使自由能 降低,進而抑制生成介金屬化合物得到簡單的相結構。以往人們根據已認知的二元、三元相圖的觀察,一個具如此多種元素的合金,應會產生很多相以及介金屬化合物,具相當複雜的結構且脆性,難以分析與應用。然而事實非如此,因為高熵效應反而化繁為簡,有促進各元素混合為簡單固溶相的效果,使高熵合金在高溫下先形成一個或數個簡單固溶相,而使合金從高溫至低溫的相變化及所得的相比想像單純,不但較容易分析,且更具應用性。總結來說,利用高熵效應,可以避免過多複雜的介金屬相生成。
嚴重晶格扭曲效應
(Severe-Lattice-Distortion Effect)
「嚴重晶格扭曲效應」主要是來自合金內原子尺寸不同,在傳統合金裡,以單一種元素為主的體系中,多數原子都是與同樣的原子鍵結,所以晶格扭曲的情況不是很明顯。但高熵合金是多種原子共同構成,所有原子並無溶質和溶劑之分。在高熵合金中,每一顆原子幾乎都是跟不同原子鍵結,因此會帶來相當大的晶格畸變跟應力的影響。
嚴重晶格扭曲會導致繞射訊號的強度減弱以及繞射峰變寬。晶體結構的扭曲對於材料的機械性能、物理和化學性能都會產生影響,例如此效應會增加位錯運動的阻力,顯著增加合金的硬度和強度。
遲緩擴散效應
(Sluggish Diffusion Effect)
遲緩擴散效應源自於高熵合金內多種不同的元素隨機排列,原子間複雜的交互作用使得擴散變得困難且緩慢。動力學的觀點可瞭解高熵合金緩慢擴散效應,由於置換型原子主要是靠空位機制來擴散,所以具有多種元素的高熵合金,任一個空缺都面臨周圍不同元素原子的競爭,不同元素的性質不同,通常熔點較低、鍵結較弱者的原子,較易搶到空缺進行擴散。
雞尾酒效應
(Cocktail Effect)
在高熵合金中,雞尾酒效應指在合金中添加的元素會對其性質和結構造成影響。例如:添加輕元素在合金中,會使合金的密度降低;或添加其他抗氧化元素,合金抗氧化能力會提高。但高熵合金的結構可能是單相、雙相、三相等等,這些相決定了高熵合金的整體性質,每個相的大小、形狀、成分、性質都與合金的整體性質有關。而除各相本身的特性外,還需要考慮相與相之間的相互作用,因為相互作用和晶格扭曲會帶來超出預測的影響。
CALPHAD方法於高熵合金上的應用
自葉均蔚教授提出自高熵合金後,眾多研究團隊紛紛投入其中由 Cantor 等人提出的等原 子 CoCrFeMnNi 高熵合金,因具有廣泛的有前途的特性,例如良好的高溫結構穩定性以及在強度和延展性上有著出色平衡,特別是在低溫下,液體氮氣溫度(77 K),仍有優異的機械性質。
Co-Cr-Fe-Ni四元系統在高熵合金中是常見的基底,CoCrFeNi等莫耳比時能形成單一FCC 固溶相,具有高的拉伸延展性和斷裂韌性,故以往研究多停留在等莫耳比的階段。He 等人成 功透過相圖計算方法,將 Co-Cr-Fe-Ni 的 FCC 固溶相從一個組成點擴展成一整塊的固溶島。拓展成固溶體島,將使得 FCC 相高熵合金的設計更豐富且多元化,通過更改元素比例,可以在更大範圍內調整這些高熵合金的特性和成本。從前面所討論的熱力學和 He 等人的研究,單一固溶結構的高熵合金不應局限於等莫耳比的條件,而應擴展到非等莫耳比的固溶島。因此,相圖計算可以算是非常有效地和經濟地方式去設計評估高熵合金。 為了更了解 Co-Cr-Fe-Mn-Ni 高熵合金的相穩定性,Duancheng 等人研究透過熱力學數據庫且透過實驗驗證非等原子 CoCrFeMnNi基高熵合金,另一個目標則是系統性地評估 CALPHAD 方法對此類高熵合金系統的預測能力。發現 CALPHAD 模擬提供了非常一致的相穩定性評估,與實驗觀察結果非常吻合。這些包括高溫下的平衡相形成、非平衡凝固過程後的組成相、凝固過程中不利的偏析分佈以及相關的低溫相的成核和生長,為開發新合金及未來應用提供重要資訊。

F. He, Z. Wang, Q. Wu, S. Niu, J. Li, J. Wang, C.T. Liu, Scr. Mater. 131, 42-46 (2017)
相平衡(Phase Equilibria)
Phase Equilibria of the Ag-Al-Au Ternary system at 450°C
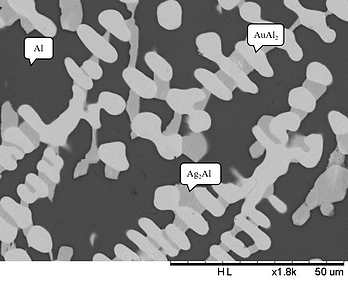
Figure 1 (a) BEI micrograph of the Alloy 1 (Ag-80 at.% l-10 at.% Au) aged at 450°Cfor 720 h.

Figure 1(a) presents the BEI micrograph of Alloy 1 (Ag-80 at.% Al-10 at.% Au). Three regions with different contrasts were observed in Fig. 1(a). The composition of the dark region is Ag-93.01 at.% Al-1.66 at.% Au, which is likely to be the (Al) phase. The composition of the light region is Ag-69.60 at.% Al-27.05 at.% Au, which is likely to be the AuAl2 phase. The composition of the gray region is Ag-39.57 at.% Al-2.92 at.% Au, which is likely to be the Ag2Al2 phase. Figure 1(b) presents the XRD pattern of Alloy 1, and shows the diffraction peaks of the (Al), AuAl2 and Ag2Al2 phases. This result is consistent with SEM/EDS analysis. The EDS and XRD results indicate that the equilibrium phases of Alloy 1 at 450°C are in the tri-angle region composed of the (Al), AuAl2 and Ag2Al2 phases. Similar results were obtained for Alloy 2 (Ag-70Al-10Au), Alloy 3 (Ag-70Al-20Au), and Alloy 4 (Ag-60Al-10Au), which showed that the three-phase region is composed of the Al, AuAl2 and Ag2Al2 phases.
Figure 1 (b) XRD pattern of the Alloy 1 (Ag-80 at.% l-10 at.% Au) aged at 450°C for 720 h.
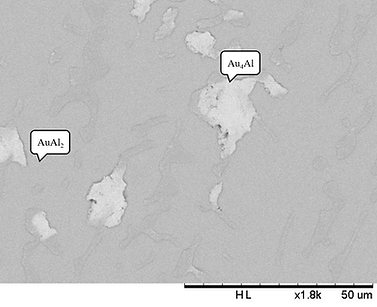
Figure 2 (a) BEI micrograph of the Alloy 5 (Ag-60 at.% l-30 at.% Au) aged at 450°C for 720 h.
Figure 2 (a) displays BEI micrograph of Alloy 5 (Ag-60 at.% l-30 at.% Au). The two phases are observed. The gray region composed of Ag-64.92 at.% Al- 31.91 at.% Au, and it is likely to be the AuAl2 phase.The composition of the bright region is Ag-27.12 at.% Al- 1.21 at.% Au, and it is likely to be the Au4Al phase.Because the Ag-Au phase diagram is isomorphous system, the considerable solubility of the Ag atoms can incorporate into the Au sublattice in the Au4Al phase. Similar results are found for Alloys 8 and 10, and both are in two phase region composed of the AuAl2 and Au4Al phases.
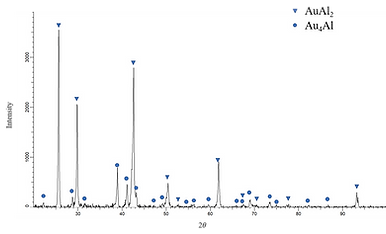
Figure 2 (b) XRD pattern of the Alloy 5 (Ag-60 at.% l-30 at.% Au) aged at 450°C for 720 h.
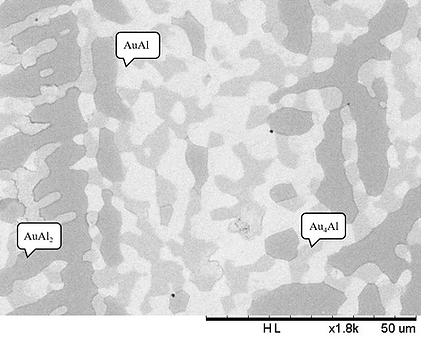
Figure 3 (a) BEI micrograph of the Alloy 6 (Ag-50.0 at.% Al-40.0 at.% Au) aged at 450°C for 720 h.
Figure 3 shows the (a) microstructure and (b) XRD pattern of Alloy 6 (Ag-50.0 at.% Al-40.0 at.% Au). For this alloy, the tree-phase region, bright, gray and dark, are observed. The compositions of these three regions are Ag-44.90 at.% Al- 52.77at.% Au (bright region), Ag-25.25 at.% Al- 39.96 at.% Au (gray region), and Ag-62.34 at.% Al-35.18 at.% Au (dark region), which are likely to be the AuAl, Au4Al and AuAl2 phases. The XRD result also confirms the presence of the AuAl, Au4Al and AuAl2 phases.
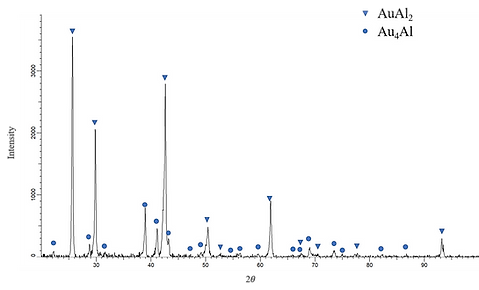
Figure 3 (b) XRD pattern of the Alloy 6 (Ag-50.0 at.% Al-40.0 at.% Au) aged at 450°C for 720 h.
Based on experimental composition and XRD results, the the isothermal of the Ag-Al-Au ternary system at 450°C is estabilished , as hown in Fig. 4. The solid lines are from the equilibrated phase experimental results, and the dashed lines are the estimated results, which one of them is estimated result without exact experimental data. The isothermal section of the Ag-Al-Au ternary system at 450°C is composed of even single-phase regions, thirteen two-phase regions, and six three-phase regions without any ternary compound found in the experimental results. The experimental results show Au4Al phase has a considerable amount of Ag in it. The reason might be that Ag and Au can easily form the continuous solid solution.
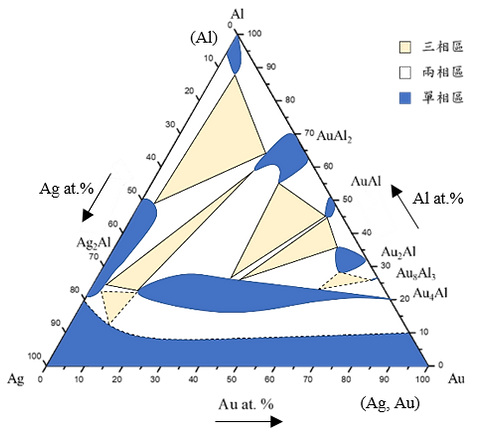
Figure 4 isothermal section of the Ag-Al-Au ternary system at 450°C. (The solid lines are depicted from the equilibrated phase experimental results, and the dashed lines are the estimated results.)
界面反應 (Interfacial Reaction)

當兩種不同成分或濃度的金屬相互接觸時,組成的差異使得界面處產生原子濃度梯度,進而產生所謂的化學勢(chemical potential)之差異。化學勢的不同,造成系統之自由能高於平衡狀態之自由能,此時需藉原子的交互擴散來降低自由能以達到平衡。若系統中兩個物質可彼此互溶,則其濃度梯度會是連續且平滑的;反之若只有部分互溶或是會反應生成新的相,此時濃度梯度會是不連續的,其所生成的相稱為介金屬相(IMC),是為界面反應(interfacial reaction)。
以A-B二元系統擴散偶為例,圖(a)為A-B二元合金的平衡相圖,其中a與b分別代表A、B金屬所構成的相,兩者形成的二元介金屬相為γ相。將A、B物質在溫度T下進行接合形成擴散偶(diffusion couple),由於彼此化學勢的不同,造成原子交互擴散,除了靠擴散使自由能下降,兩金屬也能在界面處生成γ介金屬相來降低自由能,其在溫度T之自由關係圖、化學勢關係圖如圖(b)、圖(c)所示。
根據反應溫度,一般界面反應可分為液相/固相反應與固相/固相反應兩種,前者反應溫度介於兩材料熔點之間;後者反應溫度低於兩材料熔點。液相/固相的界面反應機制較複雜,除了基本擴散機制外,亦需將固態基材與熔融金屬銲料的溶解納入考量,生成的界面型態除了平整層狀外,也可能出現波浪狀、島嶼狀等不規則形態,反觀固相/固相的界面反應,初期原子進入反應系統的速率不相同,會造成界面較為崎嶇不平整,但當反應濃度梯度趨於相等時,擴散速率相同,會生成平整的層狀的IMC結構。
Interfacial Reactions in the Au-xAg/Al couples at 450°C
Interfacial Reactions in the Au-25Ag/Al Reaction Couple
Figure 5(a) shows the BEI micrograph of the Au-25 wt.% Ag/Al reaction couple reacted at 450°C for 240 h. With the progression of the heat treatment, the metals at the interface interdiffused and reached the local equilibrium. Therefore, the IMC was formed at the interface. The IMCs were dispersed into several regions by light-dark contrast and color depth. Using EPMA and EDS for the composition analysis, the composition from the upper Al layer to the lower Au-25 wt.% Ag alloy were found to Al-32.8 at.%Au, Ag-33.7 at.%Al-66.1 at.%Au and Ag-23.5 at.%Al-45.2 at.%Au, respectively. Based on the comparison of the Ag-Al and Al-Au binary phase diagrams, we found that the first planar layer closed the Al layer is likely to be the AuAl2 phase, the second layer with the thinner layer is likely to be Au2Al phase, and the last layer near to the Au-25 wt.% Ag alloy is likely to be the Au4Al phase, with a thicker layers. As the reacted time was increased to 480 h, as shown in Fig. 5(b), the layered IMCs from the top to bottom consisted of the three Au-A1 binary phases of the AuAl2, Au2Al and Au4Al phases. Although the thickness of each IMC was increased significantly, no new IMC was formed at the interface.
When the reacted time was increased to 600, 1000 h, and 500 h (Fig. 5(c)-(e)), the IMC formed at the interface consisted of the three binary Au-Al phases of the AuAl2, Au2Al and Au4Al phase. The thickness of the first layer of the AuAl2 phase increased with the increase in reaction time. When the reaction time reached 600 h, its thickness decreased. The thickest layer of the AuAl2 phase reached about 68 μm, while the other layer of the Au2Al and Au4Al phases increased in thickness with an increase in reaction time. Based on the measurement, we found that the thickness increased from approximately 55 to 131 μm
Figure 6 shows EPMA line-scan compositional profile of the Au-25 wt.% Ag/Al (Au-37.8 at.% Ag) reaction couple reacted 450°C for 600 h. As shown in Figs. 6, the AuAl2, Au2Al and Au4Al phase were clearly observed at the interface. Fig. 6 also reveals the Au4Al phase with the considerable Ag solubility in it. These EPMA quantitative analyses were also plotted on the 450℃ isothermal section, as shown in Fig. 7. The reaction path was Al/AuAl2/Au2Al/Au4Al/Au-25 wt.% Ag alloy in the Au-25 wt.% Ag/Al couples reacted at 450℃.
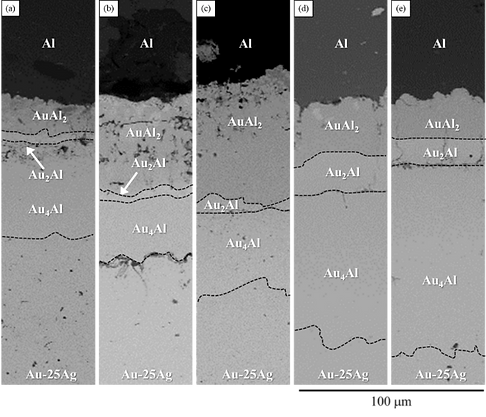
Figure 5 BEI micrographs of the Au-25Ag/Al reaction couple reacted at 450ºC for (a)240, (b)480, (c)600, (d)1000, and (e)1500 h.
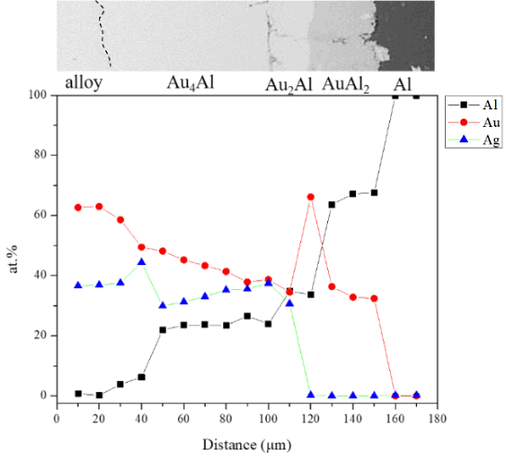
Figure 6.EPMA line-scan compositional profile of the Au-25Ag/Al reaction couple reacted at 450ºC for 600 h.
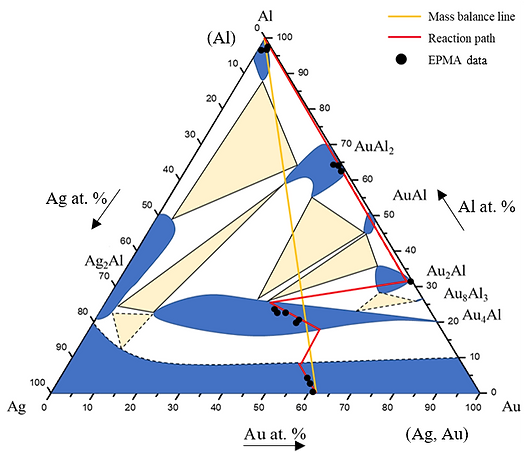
Figure 7 Reaction path of the Au-25Ag/Al reaction couple determined using EPMA line scan superimposed with experimental isothermal section at 450ºC.
Interfacial Reactions in the Au-50 Ag/Al Reaction Couple
A BEI micrograph of the Au-50 wt.% Ag/Al reaction couple reacted at 450°C for 240 h is shown in Fig. 8(a). We found that the layers formed from the upper Al layer to the lower Au-Ag alloy layer consisted of striped-shape Ag2Al phase composed of Ag-41.4 at.%Al in the are the first layer of, a net-shaped Ag2Al spread on the matrix was the AuAl2(Ag-66.2 at.%Al-32.5 at.%Au) phase. The continuous last dark gray had a composition of Ag-18.9 at.%Al-25.8 at.%Au is likely to be Au4Al phase with considerable solubility of Ag. As the reaction time was increased to 480 h (Fig. 8(b)), the IMC phases from the top to the bottom consisted the layered Ag2Al phase, the netted-shape Ag2Al spread on matrix of the AuAl2 phase and the layered Au4Al phase.
When the reaction times were increased to 600, 1000, and 1500 (Fig. 8(c-e)), the IMC phases formed at the interface were the Ag2Al phase, intersection of the Ag2Al and AuAl2 phases and Au4Al phases. The first Ag2Al layer did not show significant changes with an increase in reaction time, and by performing measurement, we found that its thickness was about 44 μm. The thickness of the second layer, consisting of two phases, increased from 113 to 176 μm. Meanwhile, the total IMC thickness was increase with the increase the reaction time.
Figure 9 shows EPMA line-scan compositional profile of the Au-50 wt.% Ag/Al (Au-64.6 at.% Ag) reaction couple reacted 450°C for 600 h. These EPMA quantitative analyses were also plotted on the 450℃ isothermal section, as shown in Fig. 10. The wave-shaped structure at the Au4Al/Al interface was observed in Fig, 8(c). The reaction path was likely to cross tie-line between the Au4Al and Al phases.The random composition distribution of Ag-Al-Au was found in Fig. 9. The probable reason might be the Ag2Al and AuAl2 phases were determined by EPMA. Thus, the netted-shape Ag2Al spread on matrix of the AuAl2 phase was observed. The reaction path in the Au-50 wt.% Ag/Al couples reacted at 450℃ was Al/Ag2Al/Ag2Ai+Au2Al/Au4Al/Au-40 wt.% Ag alloy.
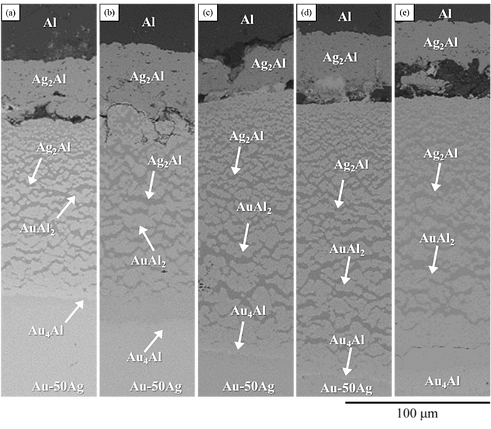
Figure 8 BEI micrographs of the Au-50Ag/Al reaction couple reacted at 450 ºC for (a)240, (b)480, (c)600, (d)1000, and (e)1500 h.

Figure 9 EPMA line-scan compositional profile of the Au-50Ag/Al reaction couple reacted at 450ºC for 600 h.
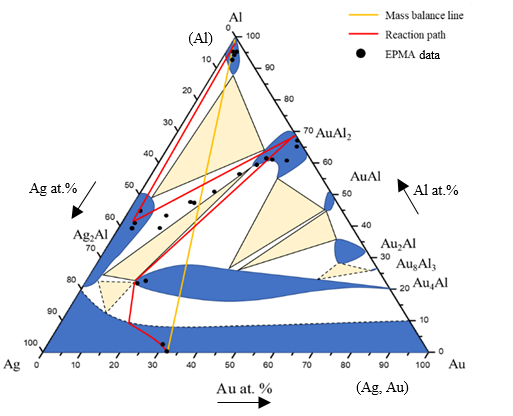
Figure 10 Reaction path of the Au-50Ag/Al reaction couple determined using EPMA line scan superimposed with experimental isothermal section at 450ºC.
Interfacial Reactions in the Au-75Ag/Al Reaction Couple
Figure 11(a) shows a BEI micrograph of the Au-75wt.% Ag/Al reaction couple reacted at 450°C for 240 h. The IMC phases were dispersed into several regions by light-dark contrast and color depth. Based on According to the comparison of the Al-Ag and Al-Au binary phase diagrams, the first layer closed to the Al substrate had a composition of Ag-37.2 at.% Al-0.5 at%Au and it was likely to be Ag2Al phase. A mixtures with micro-island shape of the AuAl2 composed Ag-58.7 at.%Al-29.1 at.%Au and Ag2Al phase were observed in the second layer. The thin layer closed to the Au-75wt.% Ag alloy was likely to be the Au4Al (Ag-20.5 at.%Al-10.6 at.%Au) phase. Similar to those finding in the Au-25wt.% Ag/Al and Au-50wt.% Ag/Al reaction couples, the Au4Al phase has a great amount of the Ag solubility. As the reaction time increased to 480 h (Fig. 11(b)), the IMC from the top to the bottom included the Ag2Al phase, mixtures of the AuAl2 and Ag2Al phases, and the thin layer of the Au4Al phase. This result was very similar to the result of the Au-50Ag/Al reaction couple. As the reaction time increased to 600 ,1000, 1500 h (Fig. 11(c-e), the same IMC structure was observed. The total IMC thickness was increased with the increase of the reaction time. However, the first layer did not show significant changes with the increase in reaction time, and we found that its thickness was about 79 μm. The thickness of the second layer, consisting of two phases, increased from 179 to 374 μm.
Figure 12 shows EPMA line-scan compositional profile of the Au-75 wt.% Ag/Al (Au-84.6 at.% Ag) reaction couple reacted 450°C for 600 h. These EPMA quantitative analyses were also plotted on the 450℃ isothermal section, as shown in Fig. 13. Similar to that in Au-50 wt.% Ag/Al reaction couple, the reaction path in the Au-50 wt.% Ag/Al couples reacted at 450℃ was Al/Ag2Al/Ag2AL+Au2Al/Au4Al/Au-75 wt.% Ag alloy.

Figure 11 BEI micrographs of the Au-75Ag/Al reaction couple reacted at 450 ºC for (a)240, (b)480, (c)600, (d)1000, and (e)1500 h.
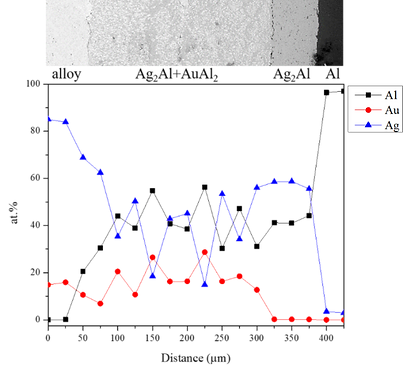
Figure 12 EPMA line-scan compositional profile of the Au-75Ag/Al reaction couple reacted at 450ºC for 600 h.
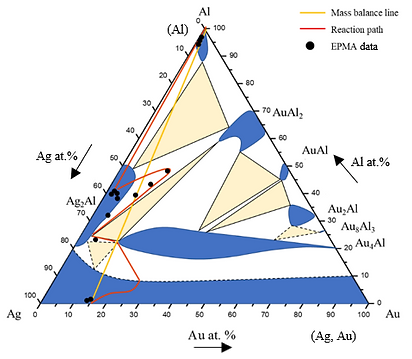
Figure 13 Reaction path of the Au-75Ag/Al reaction couple determined using EPMA line scan superimposed with experimental isothermal section at 450ºC.